符号图层(SymbolLayer)
用来加载点位信息,可设置icon以及text等属性,另还可实现点聚合功能,功能丰富。一般情况下,地图打点应该使用此图层。
非聚合示例
示例源码
tsx
import React, { useEffect, useRef, useState } from 'react'
import ReactDOM from 'react-dom'
import { MbMap, MbSymbolLayer, MbTiandituLayer } from '@mapbox-react/core'
import type { SymbolLayerData } from '@mapbox-react/core'

const App = () => {
  const [mapCenter] = useState([116.194322, 39.925238])
  const [zoom, setZoom] = useState(8)

  const [symbolDataSource, setSymbolDataSource] = useState<SymbolLayerData>([])

  const getRandomArbitrary = (min: number, max: number) => {
    return Math.random() * (max - min) + min
  }
  const loadSymbolData = () => {
    const data: SymbolLayerData = []
    for (let i = 0; i < 2000; i++) {
      data.push({
        coordinates: [getRandomArbitrary(95, 120), getRandomArbitrary(30, 42)],
        properties: {
          label: `测试-${i}`,
          icon: 'airport-15',
        },
      })
    }
    setSymbolDataSource(data)
  }

  useEffect(() => {
    loadSymbolData()
  }, [])

  const clickLayerHandler = (payload: any) => {
    console.log('clickLayerHandler', payload)
  }
  const leaveLayerHandler = () => { }

  return (
    <div className="map-wrapper">
      <MbMap
        center={mapCenter}
        zoom={zoom}
        glyphs="https://mapbox-web.github.io/mapbox-react/fonts/{fontstack}/{range}.pbf"
        sprite="https://mapbox-web.github.io/mapbox-react/sprites/sprite"
      >
        <MbTiandituLayer types={['vec']} />
        <MbSymbolLayer
          data={symbolDataSource}
          textField="label"
          textFont={['Open Sans Regular']}
          iconImageField="icon"
          textHaloColor="#9e9e9e"
          textHaloWidth={1}
          textOffset={[0, -1]}
          cluster={false}
          onMouseMove={clickLayerHandler}
          onMouseLeave={leaveLayerHandler}
        />
      </MbMap>
    </div>
  )
}

ReactDOM.render(<App />, document.querySelector('#root'))聚合示例
示例源码
tsx
import React, { useEffect, useRef, useState } from 'react'
import ReactDOM from 'react-dom'
import { MbMap, MbSymbolLayer, MbTiandituLayer } from '@mapbox-react/core'
import type { SymbolLayerData } from '@mapbox-react/core'

const App = () => {
  const [mapCenter] = useState([116.194322, 39.925238])
  const [zoom, setZoom] = useState(4.5)

  const [symbolDataSource, setSymbolDataSource] = useState<SymbolLayerData>([])

  const getRandomArbitrary = (min: number, max: number) => {
    return Math.random() * (max - min) + min
  }
  const loadSymbolData2 = () => {
    const data: SymbolLayerData = []
    for (let i = 0; i < 2000; i++) {
      data.push({
        coordinates: [getRandomArbitrary(95, 120), getRandomArbitrary(30, 42)],
        properties: {
          label: `测试-${i}`,
          icon: 'airport-15',
        },
      })
    }
    for (let i = 0; i < 13; i++) {
      data.push({
        coordinates: [116.678, 31.456],
        properties: {
          label: `same-${i}`,
          icon: 'airport-15',
        },
      })
    }
    setSymbolDataSource(data)
  }

  useEffect(() => {
    loadSymbolData2()
  }, [])

  return (
    <div className="map-wrapper">
      <MbMap
        center={mapCenter}
        zoom={zoom}
        glyphs="https://mapbox-web.github.io/mapbox-react/fonts/{fontstack}/{range}.pbf"
        sprite="https://mapbox-web.github.io/mapbox-react/sprites/sprite"
      >
        <MbTiandituLayer types={['vec']} />
        <MbSymbolLayer
          data={symbolDataSource}
          textField="label"
          textFont={['Open Sans Regular']}
          iconImageField="icon"
          textOffset={[0, -1]}
          cluster={true}
          spiderify={true}
        />
      </MbMap>
    </div>
  )
}
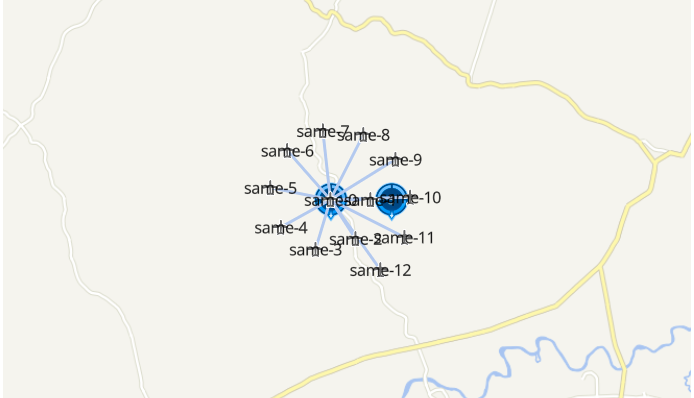
ReactDOM.render(<App />, document.querySelector('#root'))点避让示例
放大地图,在聚合点不能在散开以后,可以点击聚合点,聚合的点将以某个形状散开。
效果图
示例源码
tsx
import React, { useEffect, useRef, useState } from 'react'
import ReactDOM from 'react-dom'
import {
  MbImageLoader,
  MbMap,
  MbSymbolLayer,
  MbTiandituLayer,
} from '@mapbox-react/core'
import type { SymbolLayerData } from '@mapbox-react/core'

const App = () => {
  const [mapCenter] = useState([116.678, 31.586])
  const [zoom, setZoom] = useState(8)

  const [symbolDataSource, setSymbolDataSource] = useState<SymbolLayerData>([])
  const [symbolDataSource2, setSymbolDataSource2] = useState<SymbolLayerData>(
    []
  )

  const images = [
    {
      name: 'cluster-icon',
      type: 'link',
      url: 'https://mapbox-web.github.io/mapbox-react/images/common_toget.png',
    },
    {
      name: 'cluster-icon2',
      type: 'link',
      url: 'https://mapbox-web.github.io/mapbox-react/images/eme_team_soc_toget.png',
    },
  ]

  const clusterIcons = [
    {
      textColor: 'white',
      textSize: 12,
      iconName: 'cluster-icon',
    },
  ]
  const clusterIcons2 = [
    {
      textColor: 'white',
      textSize: 16,
      iconName: 'cluster-icon2',
    },
  ]

  const loadSymbolData3 = () => {
    const data: SymbolLayerData = [],
      data2: SymbolLayerData = []
    for (let i = 0; i < 13; i++) {
      data.push({
        coordinates: [116.678, 31.456],
        properties: {
          label: `same-${i}`,
          icon: 'airport-15',
        },
      })
      data2.push({
        coordinates: [116.788, 31.956],
        properties: {
          label: `same2-${i}`,
          icon: 'airport-15',
        },
      })
    }
    for (let i = 0; i < 5; i++) {
      data.push({
        coordinates: [116.688, 31.456],
        properties: {
          label: `same-2-${i}`,
          icon: 'airport-15',
        },
      })
      data2.push({
        coordinates: [116.788, 31.956],
        properties: {
          label: `same-2-${i}`,
          icon: 'airport-15',
        },
      })
    }
    setSymbolDataSource(data)
    setSymbolDataSource2(data2)
  }

  useEffect(() => {
    loadSymbolData3()
  }, [])

  return (
    <div className="map-wrapper">
      <MbMap
        center={mapCenter}
        zoom={zoom}
        glyphs="https://mapbox-web.github.io/mapbox-react/fonts/{fontstack}/{range}.pbf"
        sprite="https://mapbox-web.github.io/mapbox-react/sprites/sprite"
      >
        <MbImageLoader images={images} />
        <MbTiandituLayer types={['vec']} />
        <MbSymbolLayer
          data={symbolDataSource}
          textField="label"
          textFont={['Open Sans Regular']}
          iconImageField="icon"
          clusterIcons={clusterIcons}
          clusterIconSize={0.5}
          clusterIconOffset={[1, 5]}
          cluster={true}
          spiderify={true}
        />
        <MbSymbolLayer
          data={symbolDataSource2}
          textField="label"
          textFont={['Open Sans Regular']}
          iconImageField="icon"
          clusterIcons={clusterIcons2}
          clusterIconSize={0.5}
          clusterIconOffset={[1, 45]}
          cluster={true}
          spiderify={true}
        />
      </MbMap>
    </div>
  )
}

ReactDOM.render(<App />, document.querySelector('#root'))动画示例
示例源码
tsx
import React, { useEffect, useRef, useState } from 'react'
import ReactDOM from 'react-dom'
import * as turf from '@turf/turf'
import {
  MbImageLoader,
  MbMap,
  MbPolylineLayer,
  MbSymbolLayer,
  MbTiandituLayer,
} from '@mapbox-react/core'
import type { SymbolLayerData } from '@mapbox-react/core'

const App = () => {
  const [mapCenter] = useState([87.5390625, 11.178401873711785])
  const [zoom, setZoom] = useState(1)

  const images = [
    {
      name: 'cluster-icon',
      type: 'link',
      url: 'https://mapbox-web.github.io/mapbox-react/images/common_toget.png',
    },
    {
      name: 'cluster-icon2',
      type: 'link',
      url: 'https://mapbox-web.github.io/mapbox-react/images/eme_team_soc_toget.png',
    },
  ]
  const polylineCoordinates = [
    {
      coordinates: [
        [137.4609375, 39.639537564366684],
        [136.7578125, 49.38237278700955],
        [126.5625, 54.77534585936447],
        [103.35937499999999, 53.9560855309879],
        [83.3203125, 47.040182144806664],
        [66.796875, 34.59704151614417],
        [73.47656249999999, 21.94304553343818],
        [87.5390625, 11.178401873711785],
        [105.1171875, 8.754794702435618],
        [115.6640625, 13.581920900545844],
        [114.9609375, 25.48295117535531],
        [93.8671875, 25.799891182088334],
        [85.4296875, 31.653381399664],
        [91.0546875, 39.095962936305476],
        [104.765625, 41.50857729743935],
        [114.9609375, 41.50857729743935],
        [121.28906250000001, 37.71859032558816],
        [127.265625, 32.84267363195431],
        [130.78125, 28.92163128242129],
      ],
    },
    {
      coordinates: [
        [47.8125, -24.846565348219734],
        [183.1640625, -19.642587534013032],
        [176.48437499999997, 70.02058730174062],
        [33.046875, 67.60922060496382],
        [33.046875, -22.91792293614603],
        [31.9921875, -26.11598592533351],
      ],
    },
  ]

  let counter = 0
  const steps = 18
  const start = () => {
    counter = 0
    animate()
  }
  const animate = () => {
    const start =
      polylineCoordinates[0].coordinates[
      counter >= steps ? counter - 1 : counter
      ]
    const end =
      polylineCoordinates[0].coordinates[
      counter >= steps ? counter : counter + 1
      ]
    if (!start || !end || counter > steps) {
      counter = 0
      return
    }
    // Update point geometry to a new position based on counter denoting
    // the index to access the arc
    // symbolDataSource.value[0].coordinates = polylineCoordinates[0].coordinates[counter]

    // Calculate the bearing to ensure the icon is rotated to match the route arc
    // The bearing is calculated between the current point and the next point, except
    // at the end of the arc, which uses the previous point and the current point
    // symbolDataSource.value[0].properties.bearing = turf.bearing(
    //   turf.point(start),
    //   turf.point(end),
    // )

    setSymbolDataSource([
      {
        ...symbolDataSource[0],
        coordinates: polylineCoordinates[0].coordinates[counter],
        properties: {
          ...symbolDataSource[0].properties,
          bearing: turf.bearing(turf.point(start), turf.point(end)),
        },
      },
    ])

    // Request the next frame of animation as long as the end has not been reached
    if (counter < steps) {
      // requestAnimationFrame(this.animate);
      window.setTimeout(animate, 1500)
    }

    counter++
  }

  const [symbolDataSource, setSymbolDataSource] = useState<SymbolLayerData>([])

  const loadSymbolData4 = () => {
    setSymbolDataSource([
      {
        coordinates: [116.28, 39.91],
        properties: {
          label: ``,
          icon: 'cluster-icon',
          iconSize: 0.5,
          bearing: 0,
        },
      },
    ])
  }

  useEffect(() => {
    loadSymbolData4()
  }, [])

  return (
    <div className="map-wrapper">
      <MbMap
        center={mapCenter}
        zoom={zoom}
        glyphs="https://mapbox-web.github.io/mapbox-react/fonts/{fontstack}/{range}.pbf"
        sprite="https://mapbox-web.github.io/mapbox-react/sprites/sprite"
      >
        <div className="action-bar">
          <button className="primary" onClick={start}>
            重新开始
          </button>
        </div>
        <MbImageLoader images={images} />
        <MbTiandituLayer types={['vec']} />

        <MbPolylineLayer data={polylineCoordinates} width={3} color="blue" />
        <MbSymbolLayer
          data={symbolDataSource}
          iconImageField="icon"
          iconAnchor="center"
          iconSize={0.5}
          iconRotationAlignment="map"
          iconAllowOverlap={true}
          iconRotate={['get', 'bearing']}
          iconIgnorePlacement={true}
        />
      </MbMap>
    </div>
  )
}

ReactDOM.render(<App />, document.querySelector('#root'))Popup示例
示例源码
tsx
import React, { useEffect, useRef, useState } from 'react'
import ReactDOM from 'react-dom'
import {
  MbMap,
  MbMapPopup,
  MbSymbolLayer,
  MbTiandituLayer,
} from '@mapbox-react/core'
import type { SymbolLayerData } from '@mapbox-react/core'

const App = () => {
  const [mapCenter] = useState([116.194322, 39.925238])
  const [zoom, setZoom] = useState(8)

  const [symbolDataSource, setSymbolDataSource] = useState<SymbolLayerData>([])

  const getRandomArbitrary = (min: number, max: number) => {
    return Math.random() * (max - min) + min
  }
  const loadSymbolData = () => {
    const data: SymbolLayerData = []
    for (let i = 0; i < 2000; i++) {
      data.push({
        coordinates: [getRandomArbitrary(95, 120), getRandomArbitrary(30, 42)],
        properties: {
          id: String(Math.random()),
          label: `Airport-${i}`,
          icon: 'airport-15',
        },
      })
    }
    setSymbolDataSource(data)
  }

  useEffect(() => {
    loadSymbolData()
  }, [])

  return (
    <div className="map-wrapper">
      <MbMap
        center={mapCenter}
        zoom={zoom}
        glyphs="https://mapbox-web.github.io/mapbox-react/fonts/{fontstack}/{range}.pbf"
        sprite="https://mapbox-web.github.io/mapbox-react/sprites/sprite"
      >
        <MbTiandituLayer types={['vec']} />
        <MbSymbolLayer
          data={symbolDataSource}
          textField="label"
          textFont={['Open Sans Regular']}
          iconImageField="icon"
          textHaloColor="#9e9e9e"
          textHaloWidth={1}
          textOffset={[0, -1]}
        />
        {symbolDataSource.map((s) => (
          <MbMapPopup
            key={s.properties?.id}
            coordinates={s.coordinates}
            offset={[0, -10]}
            showTip={false}
            anchor="bottom"
          >
            <div
              style={{
                padding: '4px',
                backgroundColor: 'white',
                boxShadow: '10px 5px 10px grey',
              }}
            >
              {`${s.properties?.label}`}
            </div>
          </MbMapPopup>
        ))}
      </MbMap>
    </div>
  )
}

ReactDOM.render(<App />, document.querySelector('#root'))API
PROPS
| 名称 | 描述 | 类型 | 默认值 |
|---|---|---|---|
| id | 图层id | string | - |
| cluster | 是否聚合 | boolean | false |
| clusterIcons | 聚合图层图标配置信息 | IndexAny[] | 见示例说明 |
| clusterMaxZoom | 聚合效果可用的最大缩放级别 | number | 14 |
| clusterMinPoints | 聚合效果最小聚合点数 | number | 2 |
| clusterRadius | 聚合半径,单位像素 | number | 50 |
| clusterIconSize | Icon放大倍数 | number | 1 |
| clusterIconTranslate | Icon锚点平移量,正方向为右/下 | number[] | [0,0] |
| clusterIconOffset | Icon与其锚点的距离 正向为右/下 | number[] | [0,0] |
| clusterIconAnchor | Icon锚点位置 | string | center |
| data | 矢量图层的数据 数组中每个对象需包含必需的coordinates属性以及可选的properties属性 每一个对象代表一个点/一条线/一个多边形 | SymbolLayerData | - |
| geoJsonDataSource | geojson数据源,可设为geojson数据链接或geojson数据对象;规范链接, 若设置了本属性,则data属性失效 | string / GeoJSONSource | - |
| iconAllowOverlap | 是否允许重叠 | boolean | false |
| iconAnchor | 锚点位置 | string("center", "left", "right", "top", "bottom", "top-left", "top-right", "bottom-left", "bottom-right") | center |
| iconColor | 图标颜色,仅在sdf icons生效 | string | #000000 |
| iconImage | Icon资源,预加载好的图片名 | string / AnyArr | - |
| icoImageField | Icon图片字段名,将从dataSource properties中读取 覆盖iconImage属性 | string | - |
| iconOffset | Icon与其锚点的距离 正向为右/下 | number[] | [0,0] |
| iconOpacity | Icon透明度 | number | 1 |
| iconOptional | 若为true,则icon与其他icon产生碰撞但Text未碰撞时,将只显示text | boolean | false |
| iconRotate | Icon旋转角度 | number | 0 |
| iconRotationAlignment | - | string | auto |
| iconIgnorePlacement | - | boolean | false |
| iconSize | 图标放大倍数 | number | 1 |
| iconTranslate | 锚点平移量,正方向为右/下 | number[] | [0,0] |
| maxzoom | 最大缩放级别 | number | 22 |
| minzoom | 最小缩放级别 | number | 0 |
| pickable | 图层是否响应拾取事件,若为false,则组件不会emit鼠标相关事件 | boolean | true |
| show | 是否显示 | boolean | true |
| sourceId | 图层Source的id,若设置了本ID,则geoJsonDataSource与data属性都会失效 | string | - |
| sourceLayerName | 源数据中图层名称 设置sourceId时,此属性生效 | string | - |
| text | 文本值,仅在textFiled未指定时生效 | string | - |
| textAllowOverlap | 是否允许重叠 | boolean | false |
| textAnchor | 锚定位置 | string("center", "left", "right", "top", "bottom", "top-left", "top-right", "bottom-left", "bottom-right") | center |
| textColor | 字体颜色 | string | #000000 |
| textField | 文本字段值/键值,将从dataSource properties中取值 | string | - |
| textCont | 文字字体 Open Sans SemiBold | array | ["Open Sans SemiBold"] |
| textHaloBlur | 文本边框炫光效果,以像素为单位 | number | 0 |
| textHaloColor | 文本边框颜色 | string | rgba(0, 0, 0, 0) |
| textHaloWidth | 文本边框宽度,像素为单位 | number | 0 |
| textLetterSpacing | 文字间距 em为单位 | number | 0 |
| textLineHeight | em为单位 | number | 1.2 |
| textMaxWidth | em为单位 | number | 10 |
| textOffset | text与其锚点的距离 正向为右/下 px | number[] | [0,0] |
| textOpacity | 字体透明度 | number | 1 |
| textOptional | 若为true,则text与其他text产生碰撞但icon未碰撞时,将只显示icon | boolean | false |
| textSize | 文本字号大小,单位px | number | 16 |
| textTranslate | 锚点平移量,正方向为右/下 px | number[] | [0,0] |
| textPadding | 文字间距 | number | 2 |
| spiderify | 具有相同经纬度点是否可以展开 | boolean | false |
| maxLeafesTospiderify | 最大展开数量 | number | 50 |
| distanceBetweenSpiderPoints | 展开点间距 | number | 50 |
| spiderLegColor | 展开点线颜色 | string | #B6CBED |
| spiderLegWidth | 展开点线宽度 | number | 3 |
| comparePrecision | 聚合点比较相等时的小数位数,大于comparePrecision位的小数会被截掉 | number | 5 |
| clusterSpiralPoints | 聚合点形展开形式,大于是螺旋形,小于等于是圆形 | number | 10 |
TIP
clusterIcons 可以设置 iconName 使用 ImageLoader 中加载的图片。也可以设置functionName,functionProps 属性,使用ImageLoader中内置自定义的图形,内置函数可参考ImageLoader中详细介绍。也支持functionName为自定义函数,参考ImageLoader中的functionName方法。
默认值为:
js
[
  {
    count: 50,
    textColor: "black",
    textSize: 12,
    functionName: "drawDynamicCircle",
    functionProps: {
      color: "#68B8EE",
      radius: 50,
    },
  },
  {
    count: 100,
    textColor: "black",
    textSize: 14,
    functionName: "drawDynamicCircle",
    functionProps: {
      color: "#B1E345",
      radius: 75,
    },
  },
  {
    count: 200,
    textColor: "white",
    textSize: 18,
    functionName: "drawDynamicCircle",
    functionProps: {
      color: "#F7DC00",
      radius: 100,
    },
  },
  {
    count: 500,
    textColor: "white",
    textSize: 20,
    functionName: "drawDynamicCircle",
    functionProps: {
      color: "#FA9800",
      radius: 125,
    },
  },
  {
    textColor: "white",
    textSize: 22,
    functionName: "drawDynamicCircle",
    functionProps: {
      radius: 150,
      color: "#F34A4A",
    },
  },
]EVENTS
| 名称 | 描述 | 参数 |
|---|---|---|
| onCreated | 地图初始化完成事件 | - |
| onClick | 图层单击事件 | object — 包含屏幕坐标pixel、经纬度coordinate与选中元素的属性properties、originalEvent |
| onClusterClick | 单击图层不能在下钻聚合点事件 | object — 包含屏幕坐标pixel、经纬度coordinate与聚合数据data、originalEvent |
| onMouseMove | 鼠标移动事件 | object — 包含屏幕坐标pixel、经纬度coordinate与选中元素的属性properties、originalEvent |
| onMouseEnter | 鼠标移进事件 | object — 包含屏幕坐标pixel、经纬度coordinate与选中元素的属性properties、originalEvent |
| onMouseLeave | 鼠标移出元素事件 | MapMouseEvent |
METHODS
| 名称 | 描述 | 定义 |
|---|---|---|
| exportToGeoJson | 将本图层数据导出为geojson格式数据文本 若图层数据源来自source组件或为url,则输出null | ()=> object | null |