SymbolLayer
This layer is used to load point information and allows setting properties such as icon and text. It also supports point clustering and offers rich functionality. Generally, this layer should be used for adding points to the map.
Non-Clustered Example
Example Source Code
import React, { useEffect, useRef, useState } from 'react'
import ReactDOM from 'react-dom'
import { MbMap, MbSymbolLayer, MbTiandituLayer } from '@mapbox-react/core'
import type { SymbolLayerData } from '@mapbox-react/core'

const App = () => {
  const [mapCenter] = useState([116.194322, 39.925238])
  const [zoom, setZoom] = useState(8)

  const [symbolDataSource, setSymbolDataSource] = useState<SymbolLayerData>([])

  const getRandomArbitrary = (min: number, max: number) => {
    return Math.random() * (max - min) + min
  }
  const loadSymbolData = () => {
    const data: SymbolLayerData = []
    for (let i = 0; i < 2000; i++) {
      data.push({
        coordinates: [getRandomArbitrary(95, 120), getRandomArbitrary(30, 42)],
        properties: {
          label: `测试-${i}`,
          icon: 'airport-15',
        },
      })
    }
    setSymbolDataSource(data)
  }

  useEffect(() => {
    loadSymbolData()
  }, [])

  const clickLayerHandler = (payload: any) => {
    console.log('clickLayerHandler', payload)
  }
  const leaveLayerHandler = () => { }

  return (
    <div className="map-wrapper">
      <MbMap
        center={mapCenter}
        zoom={zoom}
        glyphs="https://mapbox-web.github.io/mapbox-react/fonts/{fontstack}/{range}.pbf"
        sprite="https://mapbox-web.github.io/mapbox-react/sprites/sprite"
      >
        <MbTiandituLayer types={['vec']} />
        <MbSymbolLayer
          data={symbolDataSource}
          textField="label"
          textFont={['Open Sans Regular']}
          iconImageField="icon"
          textHaloColor="#9e9e9e"
          textHaloWidth={1}
          textOffset={[0, -1]}
          cluster={false}
          onMouseMove={clickLayerHandler}
          onMouseLeave={leaveLayerHandler}
        />
      </MbMap>
    </div>
  )
}

ReactDOM.render(<App />, document.querySelector('#root'))Clustered Example
Example Source Code
import React, { useEffect, useRef, useState } from 'react'
import ReactDOM from 'react-dom'
import { MbMap, MbSymbolLayer, MbTiandituLayer } from '@mapbox-react/core'
import type { SymbolLayerData } from '@mapbox-react/core'

const App = () => {
  const [mapCenter] = useState([116.194322, 39.925238])
  const [zoom, setZoom] = useState(4.5)

  const [symbolDataSource, setSymbolDataSource] = useState<SymbolLayerData>([])

  const getRandomArbitrary = (min: number, max: number) => {
    return Math.random() * (max - min) + min
  }
  const loadSymbolData2 = () => {
    const data: SymbolLayerData = []
    for (let i = 0; i < 2000; i++) {
      data.push({
        coordinates: [getRandomArbitrary(95, 120), getRandomArbitrary(30, 42)],
        properties: {
          label: `测试-${i}`,
          icon: 'airport-15',
        },
      })
    }
    for (let i = 0; i < 13; i++) {
      data.push({
        coordinates: [116.678, 31.456],
        properties: {
          label: `same-${i}`,
          icon: 'airport-15',
        },
      })
    }
    setSymbolDataSource(data)
  }

  useEffect(() => {
    loadSymbolData2()
  }, [])

  return (
    <div className="map-wrapper">
      <MbMap
        center={mapCenter}
        zoom={zoom}
        glyphs="https://mapbox-web.github.io/mapbox-react/fonts/{fontstack}/{range}.pbf"
        sprite="https://mapbox-web.github.io/mapbox-react/sprites/sprite"
      >
        <MbTiandituLayer types={['vec']} />
        <MbSymbolLayer
          data={symbolDataSource}
          textField="label"
          textFont={['Open Sans Regular']}
          iconImageField="icon"
          textOffset={[0, -1]}
          cluster={true}
          spiderify={true}
        />
      </MbMap>
    </div>
  )
}
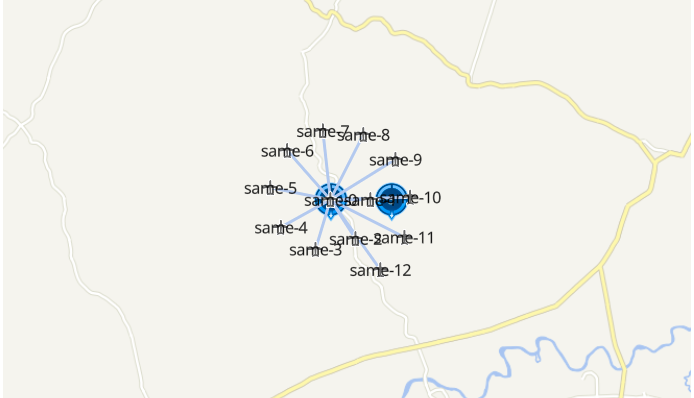
ReactDOM.render(<App />, document.querySelector('#root'))Point Displacement Example (Spiderfy)
Zoom in on the map. After the clustered points can no longer be separated by zooming, you can click on the cluster point, and the clustered points will spread out in a certain shape.
Preview
Example Source Code
import React, { useEffect, useRef, useState } from 'react'
import ReactDOM from 'react-dom'
import {
  MbImageLoader,
  MbMap,
  MbSymbolLayer,
  MbTiandituLayer,
} from '@mapbox-react/core'
import type { SymbolLayerData } from '@mapbox-react/core'

const App = () => {
  const [mapCenter] = useState([116.678, 31.586])
  const [zoom, setZoom] = useState(8)

  const [symbolDataSource, setSymbolDataSource] = useState<SymbolLayerData>([])
  const [symbolDataSource2, setSymbolDataSource2] = useState<SymbolLayerData>(
    []
  )

  const images = [
    {
      name: 'cluster-icon',
      type: 'link',
      url: 'https://mapbox-web.github.io/mapbox-react/images/common_toget.png',
    },
    {
      name: 'cluster-icon2',
      type: 'link',
      url: 'https://mapbox-web.github.io/mapbox-react/images/eme_team_soc_toget.png',
    },
  ]

  const clusterIcons = [
    {
      textColor: 'white',
      textSize: 12,
      iconName: 'cluster-icon',
    },
  ]
  const clusterIcons2 = [
    {
      textColor: 'white',
      textSize: 16,
      iconName: 'cluster-icon2',
    },
  ]

  const loadSymbolData3 = () => {
    const data: SymbolLayerData = [],
      data2: SymbolLayerData = []
    for (let i = 0; i < 13; i++) {
      data.push({
        coordinates: [116.678, 31.456],
        properties: {
          label: `same-${i}`,
          icon: 'airport-15',
        },
      })
      data2.push({
        coordinates: [116.788, 31.956],
        properties: {
          label: `same2-${i}`,
          icon: 'airport-15',
        },
      })
    }
    for (let i = 0; i < 5; i++) {
      data.push({
        coordinates: [116.688, 31.456],
        properties: {
          label: `same-2-${i}`,
          icon: 'airport-15',
        },
      })
      data2.push({
        coordinates: [116.788, 31.956],
        properties: {
          label: `same-2-${i}`,
          icon: 'airport-15',
        },
      })
    }
    setSymbolDataSource(data)
    setSymbolDataSource2(data2)
  }

  useEffect(() => {
    loadSymbolData3()
  }, [])

  return (
    <div className="map-wrapper">
      <MbMap
        center={mapCenter}
        zoom={zoom}
        glyphs="https://mapbox-web.github.io/mapbox-react/fonts/{fontstack}/{range}.pbf"
        sprite="https://mapbox-web.github.io/mapbox-react/sprites/sprite"
      >
        <MbImageLoader images={images} />
        <MbTiandituLayer types={['vec']} />
        <MbSymbolLayer
          data={symbolDataSource}
          textField="label"
          textFont={['Open Sans Regular']}
          iconImageField="icon"
          clusterIcons={clusterIcons}
          clusterIconSize={0.5}
          clusterIconOffset={[1, 5]}
          cluster={true}
          spiderify={true}
        />
        <MbSymbolLayer
          data={symbolDataSource2}
          textField="label"
          textFont={['Open Sans Regular']}
          iconImageField="icon"
          clusterIcons={clusterIcons2}
          clusterIconSize={0.5}
          clusterIconOffset={[1, 45]}
          cluster={true}
          spiderify={true}
        />
      </MbMap>
    </div>
  )
}

ReactDOM.render(<App />, document.querySelector('#root'))Animation Example
Example Source Code
import React, { useEffect, useRef, useState } from 'react'
import ReactDOM from 'react-dom'
import * as turf from '@turf/turf'
import {
  MbImageLoader,
  MbMap,
  MbPolylineLayer,
  MbSymbolLayer,
  MbTiandituLayer,
} from '@mapbox-react/core'
import type { SymbolLayerData } from '@mapbox-react/core'

const App = () => {
  const [mapCenter] = useState([87.5390625, 11.178401873711785])
  const [zoom, setZoom] = useState(1)

  const images = [
    {
      name: 'cluster-icon',
      type: 'link',
      url: 'https://mapbox-web.github.io/mapbox-react/images/common_toget.png',
    },
    {
      name: 'cluster-icon2',
      type: 'link',
      url: 'https://mapbox-web.github.io/mapbox-react/images/eme_team_soc_toget.png',
    },
  ]
  const polylineCoordinates = [
    {
      coordinates: [
        [137.4609375, 39.639537564366684],
        [136.7578125, 49.38237278700955],
        [126.5625, 54.77534585936447],
        [103.35937499999999, 53.9560855309879],
        [83.3203125, 47.040182144806664],
        [66.796875, 34.59704151614417],
        [73.47656249999999, 21.94304553343818],
        [87.5390625, 11.178401873711785],
        [105.1171875, 8.754794702435618],
        [115.6640625, 13.581920900545844],
        [114.9609375, 25.48295117535531],
        [93.8671875, 25.799891182088334],
        [85.4296875, 31.653381399664],
        [91.0546875, 39.095962936305476],
        [104.765625, 41.50857729743935],
        [114.9609375, 41.50857729743935],
        [121.28906250000001, 37.71859032558816],
        [127.265625, 32.84267363195431],
        [130.78125, 28.92163128242129],
      ],
    },
    {
      coordinates: [
        [47.8125, -24.846565348219734],
        [183.1640625, -19.642587534013032],
        [176.48437499999997, 70.02058730174062],
        [33.046875, 67.60922060496382],
        [33.046875, -22.91792293614603],
        [31.9921875, -26.11598592533351],
      ],
    },
  ]

  let counter = 0
  const steps = 18
  const start = () => {
    counter = 0
    animate()
  }
  const animate = () => {
    const start =
      polylineCoordinates[0].coordinates[
      counter >= steps ? counter - 1 : counter
      ]
    const end =
      polylineCoordinates[0].coordinates[
      counter >= steps ? counter : counter + 1
      ]
    if (!start || !end || counter > steps) {
      counter = 0
      return
    }
    // Update point geometry to a new position based on counter denoting
    // the index to access the arc
    // symbolDataSource.value[0].coordinates = polylineCoordinates[0].coordinates[counter]

    // Calculate the bearing to ensure the icon is rotated to match the route arc
    // The bearing is calculated between the current point and the next point, except
    // at the end of the arc, which uses the previous point and the current point
    // symbolDataSource.value[0].properties.bearing = turf.bearing(
    //   turf.point(start),
    //   turf.point(end),
    // )

    setSymbolDataSource([
      {
        ...symbolDataSource[0],
        coordinates: polylineCoordinates[0].coordinates[counter],
        properties: {
          ...symbolDataSource[0].properties,
          bearing: turf.bearing(turf.point(start), turf.point(end)),
        },
      },
    ])

    // Request the next frame of animation as long as the end has not been reached
    if (counter < steps) {
      // requestAnimationFrame(this.animate);
      window.setTimeout(animate, 1500)
    }

    counter++
  }

  const [symbolDataSource, setSymbolDataSource] = useState<SymbolLayerData>([])

  const loadSymbolData4 = () => {
    setSymbolDataSource([
      {
        coordinates: [116.28, 39.91],
        properties: {
          label: ``,
          icon: 'cluster-icon',
          iconSize: 0.5,
          bearing: 0,
        },
      },
    ])
  }

  useEffect(() => {
    loadSymbolData4()
  }, [])

  return (
    <div className="map-wrapper">
      <MbMap
        center={mapCenter}
        zoom={zoom}
        glyphs="https://mapbox-web.github.io/mapbox-react/fonts/{fontstack}/{range}.pbf"
        sprite="https://mapbox-web.github.io/mapbox-react/sprites/sprite"
      >
        <div className="action-bar">
          <button className="primary" onClick={start}>
            重新开始
          </button>
        </div>
        <MbImageLoader images={images} />
        <MbTiandituLayer types={['vec']} />

        <MbPolylineLayer data={polylineCoordinates} width={3} color="blue" />
        <MbSymbolLayer
          data={symbolDataSource}
          iconImageField="icon"
          iconAnchor="center"
          iconSize={0.5}
          iconRotationAlignment="map"
          iconAllowOverlap={true}
          iconRotate={['get', 'bearing']}
          iconIgnorePlacement={true}
        />
      </MbMap>
    </div>
  )
}

ReactDOM.render(<App />, document.querySelector('#root'))Popup Example
Example Source Code
import React, { useEffect, useRef, useState } from 'react'
import ReactDOM from 'react-dom'
import {
  MbMap,
  MbMapPopup,
  MbSymbolLayer,
  MbTiandituLayer,
} from '@mapbox-react/core'
import type { SymbolLayerData } from '@mapbox-react/core'

const App = () => {
  const [mapCenter] = useState([116.194322, 39.925238])
  const [zoom, setZoom] = useState(8)

  const [symbolDataSource, setSymbolDataSource] = useState<SymbolLayerData>([])

  const getRandomArbitrary = (min: number, max: number) => {
    return Math.random() * (max - min) + min
  }
  const loadSymbolData = () => {
    const data: SymbolLayerData = []
    for (let i = 0; i < 2000; i++) {
      data.push({
        coordinates: [getRandomArbitrary(95, 120), getRandomArbitrary(30, 42)],
        properties: {
          id: String(Math.random()),
          label: `Airport-${i}`,
          icon: 'airport-15',
        },
      })
    }
    setSymbolDataSource(data)
  }

  useEffect(() => {
    loadSymbolData()
  }, [])

  return (
    <div className="map-wrapper">
      <MbMap
        center={mapCenter}
        zoom={zoom}
        glyphs="https://mapbox-web.github.io/mapbox-react/fonts/{fontstack}/{range}.pbf"
        sprite="https://mapbox-web.github.io/mapbox-react/sprites/sprite"
      >
        <MbTiandituLayer types={['vec']} />
        <MbSymbolLayer
          data={symbolDataSource}
          textField="label"
          textFont={['Open Sans Regular']}
          iconImageField="icon"
          textHaloColor="#9e9e9e"
          textHaloWidth={1}
          textOffset={[0, -1]}
        />
        {symbolDataSource.map((s) => (
          <MbMapPopup
            key={s.properties?.id}
            coordinates={s.coordinates}
            offset={[0, -10]}
            showTip={false}
            anchor="bottom"
          >
            <div
              style={{
                padding: '4px',
                backgroundColor: 'white',
                boxShadow: '10px 5px 10px grey',
              }}
            >
              {`${s.properties?.label}`}
            </div>
          </MbMapPopup>
        ))}
      </MbMap>
    </div>
  )
}

ReactDOM.render(<App />, document.querySelector('#root'))API
PROPS
| 名称 | 描述 | 类型 | 默认值 |
|---|---|---|---|
| id | Layer ID | string | - |
| cluster | Whether to enable clustering | boolean | false |
| clusterIcons | Configuration information for cluster icons. See example for details | IndexAny[] | 见示例说明 |
| clusterMaxZoom | The maximum zoom level at which clustering is enabled | number | 14 |
| clusterMinPoints | The minimum number of points required for clustering | number | 2 |
| clusterRadius | Clustering radius in pixels | number | 50 |
| clusterIconSize | Icon scaling factor | number | 1 |
| clusterIconTranslate | Icon anchor translation. Positive values shift right/down | number[] | [0,0] |
| clusterIconOffset | Distance between the icon and its anchor. Positive values shift right/down | number[] | [0,0] |
| clusterIconAnchor | Icon anchor position | string | center |
| data | Data for the vector layer. Each object in the array must contain the required coordinates property and the optional properties property. Each object represents a point/line/polygon | SymbolLayerData | - |
| geoJsonDataSource | GeoJSON data source. Can be a GeoJSON data link or a GeoJSON data object. Specification Link. If this property is set, the data property is ignored. | string / GeoJSONSource | - |
| iconAllowOverlap | Whether to allow icon overlap | boolean | false |
| iconAnchor | Icon anchor position | string("center", "left", "right", "top", "bottom", "top-left", "top-right", "bottom-left", "bottom-right") | center |
| iconColor | Icon color. Only effective for SDF icons | string | #000000 |
| iconImage | Icon resource. Pre-loaded image name | string / AnyArr | - |
| iconImageField | Icon image field name. Will be read from the dataSource properties, overriding the iconImage property | string | - |
| iconOffset | Distance between the icon and its anchor. Positive values shift right/down | number[] | [0,0] |
| iconOpacity | Icon opacity | number | 1 |
| iconOptional | If true, the icon will only be displayed if it doesn't collide with other icons, but the text does not collide with other text | boolean | false |
| iconRotate | Icon rotation angle | number | 0 |
| iconRotationAlignment | - | string | auto |
| iconIgnorePlacement | - | boolean | false |
| iconSize | Icon scaling factor | number | 1 |
| iconTranslate | Icon anchor translation. Positive values shift right/down | number[] | [0,0] |
| maxzoom | Maximum zoom level | number | 22 |
| minzoom | Minimum zoom level | number | 0 |
| pickable | Whether the layer responds to pick events. If false, the component will not emit mouse-related events | boolean | true |
| show | Whether to show the layer | boolean | true |
| sourceId | ID of the layer's source. If this ID is set, the geoJsonDataSource and data properties are ignored | string | - |
| sourceLayerName | Layer name in the source data. This property is effective when sourceId is set | string | - |
| text | Text value. Only effective if textFiled is not specified | string | - |
| textAllowOverlap | Whether to allow text overlap | boolean | false |
| textAnchor | Text anchor position | string("center", "left", "right", "top", "bottom", "top-left", "top-right", "bottom-left", "bottom-right") | center |
| textColor | Text color | string | #000000 |
| textField | Text field value/key. Will be taken from the dataSource properties | string | - |
| textFont | Text font | string[] | ["Open Sans SemiBold"] |
| textHaloBlur | Text halo blur effect in pixels | number | 0 |
| textHaloColor | Text halo color | string | rgba(0, 0, 0, 0) |
| textHaloWidth | Text halo width in pixels | number | 0 |
| textLetterSpacing | Text letter spacing in em units | number | 0 |
| textLineHeight | Line height in em units | number | 1.2 |
| textMaxWidth | Maximum text width in em units | number | 10 |
| textOffset | Distance between the text and its anchor. Positive values shift right/down in pixels | number[] | [0,0] |
| textOpacity | Text opacity | number | 1 |
| textOptional | If true, the icon will be displayed only if the text collides with other text but the icon does not collide with other icons | boolean | false |
| textSize | Text font size in pixels | number | 16 |
| textTranslate | Text anchor translation. Positive values shift right/down in pixels | number[] | [0,0] |
| textPadding | Text padding | number | 2 |
| spiderify | Whether points with the same latitude and longitude can be spread out (spiderified) | boolean | false |
| maxLeafesTospiderify | Maximum number of points to spiderify | number | 50 |
| distanceBetweenSpiderPoints | Distance between spiderified points | number | 50 |
| spiderLegColor | Color of the lines connecting the spiderified points | string | #B6CBED |
| spiderLegWidth | Width of the lines connecting the spiderified points | number | 3 |
| comparePrecision | The number of decimal places used when comparing clustered points for equality. Decimal places beyond comparePrecision will be truncated | number | 5 |
| clusterSpiralPoints | The shape of the cluster expansion. If greater than this value, the expansion is spiral; if less than or equal to this value, the expansion is circular | number | 10 |
TIP
The clusterIcons property allows you to configure icons for clusters. You can set the iconName property to use images loaded by the ImageLoader. Alternatively, you can set the functionName and functionProps properties to use built-in custom graphics within the ImageLoader. Refer to the ImageLoader documentation for details on the built-in functions. It also supports using custom functions for functionName; refer to the functionName method within the ImageLoader for implementation details.
Default value:
[
  {
    count: 50,
    textColor: "black",
    textSize: 12,
    functionName: "drawDynamicCircle",
    functionProps: {
      color: "#68B8EE",
      radius: 50,
    },
  },
  {
    count: 100,
    textColor: "black",
    textSize: 14,
    functionName: "drawDynamicCircle",
    functionProps: {
      color: "#B1E345",
      radius: 75,
    },
  },
  {
    count: 200,
    textColor: "white",
    textSize: 18,
    functionName: "drawDynamicCircle",
    functionProps: {
      color: "#F7DC00",
      radius: 100,
    },
  },
  {
    count: 500,
    textColor: "white",
    textSize: 20,
    functionName: "drawDynamicCircle",
    functionProps: {
      color: "#FA9800",
      radius: 125,
    },
  },
  {
    textColor: "white",
    textSize: 22,
    functionName: "drawDynamicCircle",
    functionProps: {
      radius: 150,
      color: "#F34A4A",
    },
  },
]EVENTS
| Name | Description | Parameters |
|---|---|---|
| onCreated | Map initialization completed event | - |
| onClick | Layer click event | object — Contains screen coordinates (pixel), longitude/latitude (coordinate), selected element properties, and originalEvent |
| onClusterClick | Click event for non-drillable cluster points in layer | object — Contains screen coordinates (pixel), longitude/latitude (coordinate), cluster data, and originalEvent |
| onMouseMove | Mouse move event | object — Contains screen coordinates (pixel), longitude/latitude (coordinate), selected element properties, and originalEvent |
| onMouseEnter | Mouse enter event | object — Contains screen coordinates (pixel), longitude/latitude (coordinate), selected element properties, and originalEvent |
| onMouseLeave | Mouse leave element event | MapMouseEvent |
METHODS
| Name | Description | Definition |
|---|---|---|
| exportToGeoJson | Translate the layer's data to GeoJSON formatted text. If the layer's data source comes from a source component or a URL, output null. | ()=> object | null |